
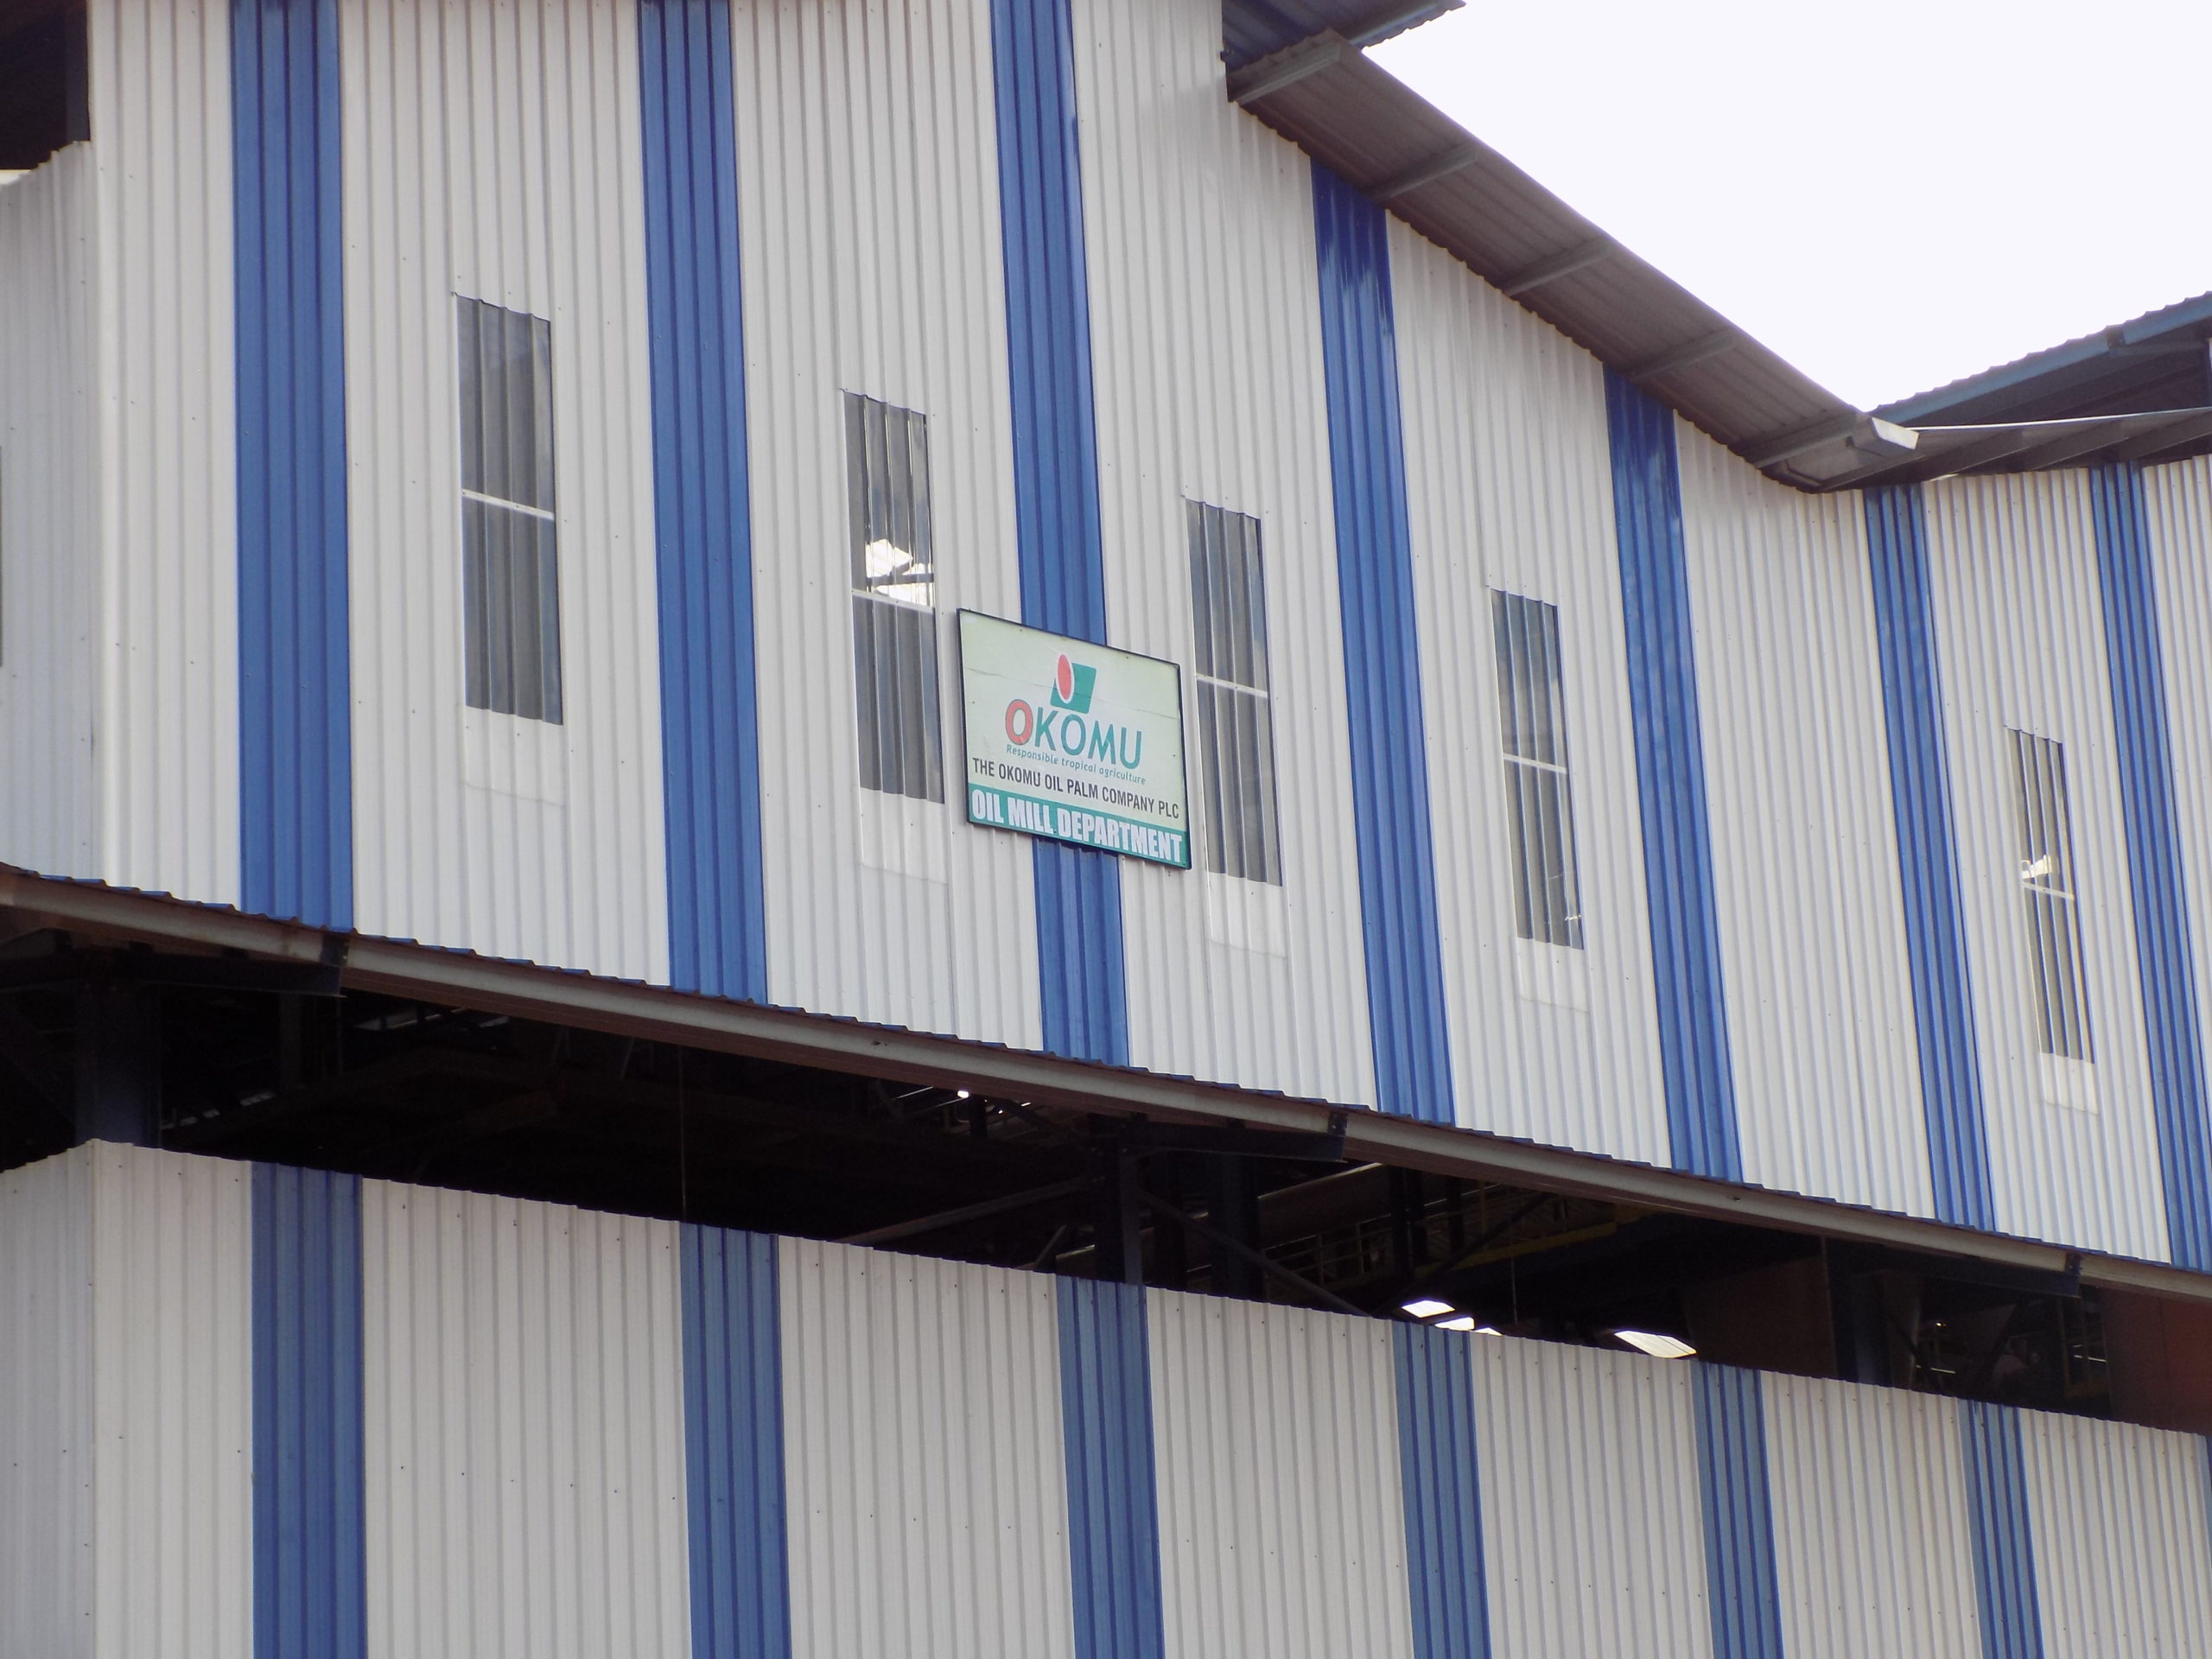
Okomu Oil Palm Company Plc's interim results for the six months ended June 30, 2026 reveal a company generating solid profits but facing clear margin pressure, with second-quarter numbers decelerating sharply from a year earlier.
Revenue & Profit Trends
Turnover fell to ₦125.3bn from ₦129.8bn a year earlier (-3.5%), while profit after tax dropped more steeply to ₦39.7bn from ₦47.5bn (-16.4%). The standalone Q2 (Apr-Jun) picture is weaker still: turnover down 7.5% and net profit down 37.5% year-on-year. Verdict: Negative. The deceleration in the most recent quarter is more concerning than the half-year figure alone.
Margins & Cost Structure
Gross margin compressed to 64.4% from 66.9%, while operating expenses jumped 12.2% even as revenue fell. Cost of sales rose nearly 4% despite lower turnover, pointing to input cost inflation (likely FX-driven, given rubber and palm inputs). Verdict: Negative. Margin erosion alongside rising costs is the report's key red flag.
Balance Sheet Strength
Here the picture brightens. Cash and bank balances rose to ₦21.4bn from ₦12.9bn at year-end, long-term loans shrank to ₦3.9bn from ₦5.0bn, and net current assets swung to a positive ₦19.1bn from a negative ₦2.5bn at December 2025. Verdict: Positive. The company is deleveraging while building liquidity — a defensive strength if commodity prices soften further.
Period-on-Period Comparison
Every major profitability line — turnover, gross profit, pre-tax profit, and EPS (₦41.65 vs ₦49.83) — declined versus H1 2025. Total comprehensive income for the half was also below the prior year. Verdict: Negative, though the balance sheet improvement partially offsets the earnings story.
Red Flags & Standout Strengths
- Red flag: Operating expense growth outpacing revenue signals cost discipline may be slipping.
- Red flag: Q2 profit decline (-37.5%) is much sharper than H1 decline, suggesting the trend is worsening, not stabilizing.
- Strength: Improved liquidity, reduced debt, and continued dividend capacity (₦14.3bn paid in the period) show balance sheet resilience.
Valuation Implications
Okomu's share price rose to ₦1,418 as of June 30, 2026 from ₦790 a year earlier — up roughly 80% — pushing market capitalisation to ₦412.1bn from ₦229.7bn, even as earnings fell. This implies significant multiple expansion: investors are paying substantially more per naira of profit than a year ago. Verdict: Caution warranted — the stock's valuation now embeds optimism the current earnings trend doesn't support.
Top 5 Investor Takeaways
- Revenue and profit both declined year-on-year, with Q2 alone down over a third on the bottom line.
- Margin compression (gross margin down ~250bps) reflects rising cost pressure not yet offset by pricing.
- Balance sheet has strengthened materially — more cash, less debt, positive working capital.
- The share price has far outrun earnings, implying a much richer valuation multiple than a year ago.
- The sequential deterioration from H1 to Q2 alone is the most important signal — the trend, not just the level, has weakened.
Overall Verdict: Neutral to Bearish
Trajectory Signal
The numbers suggest a business still fundamentally sound and well-capitalised, but facing genuine earnings deceleration and cost inflation that the market's current pricing does not seem to reflect.
Risk of Overinterpreting a Single Quarter
Agricultural commodity businesses like Okomu are inherently seasonal and exposed to FX and weather volatility; one weak quarter doesn't necessarily establish a durable trend, and investors should watch at least one more reporting period before drawing firm conclusions.

.jpg)